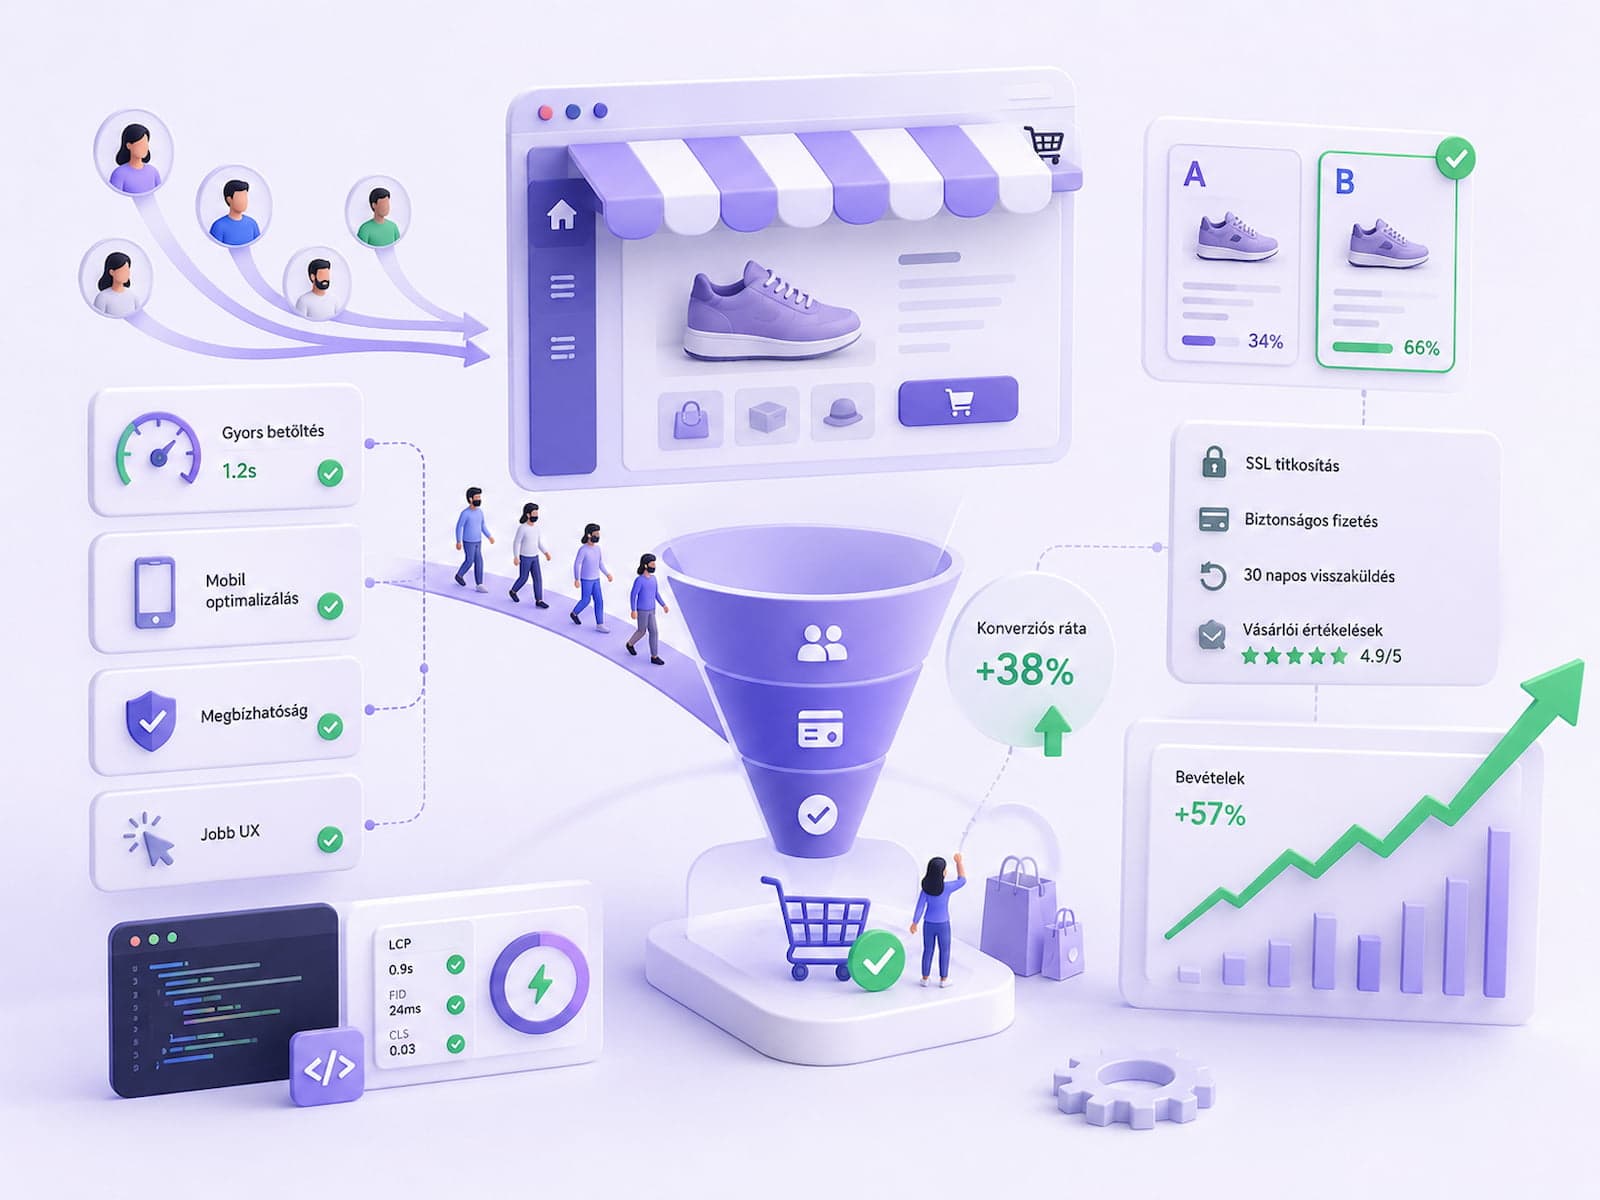
Conversion rate (CR) is one of the most rewarding areas in e-commerce — lifting a 1.5% baseline to 2.5% is not science fiction, and it translates into a 60-70% revenue uplift. Many online stores in the Hungarian market run at a 1-2% CR, while the international benchmark for B2C sits at 2-3%.
This article covers 10 concrete technical optimisations that measurably move the needle. Each one has been measured and tested on live projects in a Hungarian market context. The figures reflect Q1 2026 state-of-the-art benchmarks and draw on Baymard, GFK and Árukereső data for the Hungarian market.
What counts as a "good" CR in 2026?
Before diving into optimisation, it's worth clarifying the benchmarks. What counts as a "good" CR depends heavily on industry and product:
| Industry |
Global average CR |
Hungarian average CR |
| Fashion (B2C) |
2.7% |
1.5-2.0% |
| Electronics |
1.8% |
1.0-1.5% |
| Home & Garden |
2.4% |
1.5-2.5% |
| Food & Beverage |
4.0% |
2.5-3.5% |
| Cosmetics |
3.5% |
2.0-3.0% |
| B2B (industrial) |
0.8% |
0.5-1.0% |
In the Hungarian market, CR is often 30-40% lower than the global average — mainly due to lower trust levels and fewer payment options. Optimising this area tends to be the most rewarding.
1. Mobile LCP under 2 seconds
Mobile Largest Contentful Paint (LCP) is the #1 conversion predictor. Every 0.5s reduction correlates with a 5-10% CR increase (Google research, Web.dev case studies).
- next/image automatic optimization — WebP/AVIF delivery, lazy loading
- Font preload for the critical webfont —
<link rel="preload"> on the critical font
- Critical-path CSS inlined — first 8-12 KB inline
- Third-party scripts lazy loaded — analytics, chat widget deferred
- Image pre-fetch for hero elements —
priority prop on next/image
LCP optimisation in practice
import Image from 'next/image';

// Hero product image — above the fold, priority
<Image
  src="/products/hero.webp"
  alt="..."
  width={1200}
  height={1200}
  priority
  sizes="(max-width: 768px) 100vw, 600px"
  placeholder="blur"
/>

// Below-the-fold images — lazy by default
<Image
  src="/products/gallery-1.webp"
  alt="..."
  width={600}
  height={600}
  loading="lazy"
  sizes="(max-width: 768px) 50vw, 300px"
/>
Target
Lighthouse mobile score of 90+, LCP under 2s, INP under 200ms, CLS under 0.05.
Measurement
The Google Search Console "Core Web Vitals" report shows real user data. Lighthouse and PageSpeed Insights are synthetic benchmarks — actual Google ranking and CR impact are calculated from Search Console data.
npx unlighthouse --site https://example.com
Tip: A "90+ Lighthouse" score doesn't guarantee good real-world performance — a page can still be slow on a poor mobile network. Field data (Search Console / Web Vitals) is the metric that matters.
Users decide within the first 3 seconds whether they'll stay. Above the fold (mobile viewport ~640px):
- Product image (large, clear)
- Price (prominent, with any discount marked)
- One line of the product name (the full name follows below)
- "Add to cart" CTA (visible, not below a scroll)
- Stock status ("In stock" or "Only X left" if low)
Don't place the reviews section, related products or an email sign-up above the fold — those belong below it.
A/B test results
| Variant |
Mobile CR |
| Above the fold: image + name + price + CTA |
2.4% |
| Above the fold: image + reviews + name + price |
1.8% |
| Above the fold: image + name only (CTA further down) |
1.2% |
The "visible CTA" variant performs 2x better than the "CTA after scroll" one.
3. Trust signals in visible places
Building trust matters especially in the Hungarian market. For new online stores, this can account for a 30-50% CR difference.
Trust elements
- SSL badge (HTTPS by default — the bare minimum)
- Payment method icons (Stripe, OTP SimplePay, Barion, MasterCard, Visa, PayPal)
- A "14-day return" badge (mandatory in the EU, and worth highlighting)
- 3+ specific customer reviews (name + city + date)
- Recognisable client logos for B2B
- A Hungarian phone number — a psychological trust factor
- A postal address — proof of physical presence
- A Hungarian webshop certification, if available (Árukereső rating, Magyarbrands)
Positioning
| Element |
Location |
| SSL + payment icons |
Footer + checkout (both) |
| Return badge |
Product page, near the CTA |
| Customer reviews |
Product page, below the fold |
| Phone + address |
Footer, contact page |
| Certifications |
Footer + about page |
The Hungarian context
Hungarian B2C shoppers are still strongly trust-driven:
- 45% prefer checking Google Reviews over the shop's own reviews
- Árukereső rating is a well-known Hungarian branded trust signal
- A Hungarian phone line available during business hours (8am-5pm) is particularly valued
4. Checkout — guest checkout option
Don't force users to register. A "Checkout as guest" button on checkout adds +15-25% CR.
Variant A (require login):              CR 1.2%
Variant B (guest checkout default):     CR 1.5%
Variant C (guest first, login optional): CR 1.65%
Implementation
// Checkout step 1
<div className="space-y-4">
  <h2>Hogyan szeretnéd folytatni?</h2>

  <Button variant="primary" size="lg" onClick={() => proceedAsGuest()}>
    Vásárlás vendégként
  </Button>

  <div className="text-sm text-text-secondary">
    Vagy: <Link href="/login">Bejelentkezés</Link>
    <span className="mx-2">·</span>
    <Link href="/register">Regisztráció</Link>
  </div>
</div>
Offer account creation on the post-purchase confirmation screen instead:
Köszönjük a rendelést!

Tegyük könnyebbé a következő vásárlást egy ingyenes fiókkal:
☐ Igen, készíts nekem fiókot — csak emailt + jelszót kérünk
Every extra field costs 5-10% in bounce rate. The checkout form should only include mandatory fields:
- Email (digital receipt + tracking)
- Name (first and last name are often combined into a single field)
- Shipping address (postal code → city auto-fill)
- Phone number (for courier contact)
Billing address defaults to a "same as shipping address" checkbox. Company details (tax number) are collapsed and shown only for B2B.
Postal code auto-fill
// Hungarian postal-code-to-city mapping
async function lookupZip(zip: string): Promise<{ city: string; county: string } | null> {
  const response = await fetch(`/api/zip/${zip}`);
  if (!response.ok) return null;
  return response.json();
}

// Form
<input
  type="text"
  name="zip"
  pattern="[0-9]{4}"
  onChange={async (e) => {
    if (e.target.value.length === 4) {
      const data = await lookupZip(e.target.value);
      if (data) {
        setFormValue('city', data.city);
        setFormValue('county', data.county);
      }
    }
  }}
/>
Hotjar / FullStory session recordings show exactly which field causes users to abandon. Typical drop-off points:
- Phone number (many users are privacy-conscious) — make it optional when an email is already provided
- Tax number (irrelevant for B2C shoppers) — show only after a B2B toggle
- Second address line (apartment / unit) — make it optional
6. Sticky add-to-cart on mobile
On long product pages, users scroll down and lose sight of the CTA. A sticky bottom bar on mobile fixes this:
'use client';

import { useEffect, useState } from 'react';

export function StickyCartBar({ product }) {
  const [visible, setVisible] = useState(false);

  useEffect(() => {
    const handleScroll = () => {
      // Show after scrolling 400px (below the fold)
      setVisible(window.scrollY > 400);
    };

    window.addEventListener('scroll', handleScroll, { passive: true });
    return () => window.removeEventListener('scroll', handleScroll);
  }, []);

  if (!visible) return null;

  return (
    <div className="fixed bottom-0 left-0 right-0 z-40 border-t bg-white p-3 md:hidden
                    safe-bottom shadow-lg">
      <button
        className="w-full rounded-lg bg-accent py-3 font-semibold"
        onClick={addToCart}
      >
        Kosárba — {formatPrice(product.price)}
      </button>
    </div>
  );
}
The safe-bottom Tailwind utility handles the iPhone notch / safe area. The shadow-lg signals to the user that this is a floating element.
Measured impact
| Setup |
Mobile CR |
| Top-of-page CTA only |
1.4% |
| Sticky bottom bar |
1.55% |
| Sticky bottom bar + "discount" badge |
1.7% |
Typically +8-12% mobile CR.
7. Real-time inventory + scarcity
"Only 3 left in stock" style visual cues (FOMO triggers). Don't lie — if there's no real scarcity, don't fake it. But if there is, communicate it.
{stock <= 5 && stock > 0 && (
  <p className="text-sm text-amber-600 flex items-center gap-1.5">
    <Clock className="h-4 w-4" />
    Készleten {stock} db • Gyors szállítás
  </p>
)}

{stock === 0 && (
  <p className="text-sm text-red-600">
    Jelenleg készletkimaradás — várólista
  </p>
)}
What NOT to do
- Faking "Only 2 left!" — when there are actually 200 in stock. This is illegal under GDPR and EU unfair-commercial-practices rules (a misleading tactic).
- A fake "milestone reached" banner — fabricated social proof that frustrates users.
- A countdown timer showing "discount ends in 5:00" — if it's the same for every user, it's obviously not real.
What TO do
- Actual stock numbers — when there genuinely is limited stock
- "Others are viewing this right now" — only if you actually have real-time data
- "This product often sells out" — historical, verifiable data
8. Cart abandonment recovery
Cart abandonment in the Hungarian market typically runs at 65-80%. Recovery tactics:
- Email 1 hour later — a gentle reminder
- 24 hours later — a discount (5-10%)
- 3 days later — a "last chance" message
Typical recovery rate: 8-15%.
Implementation flow
// Trigger: add-to-cart event
async function onCartAdded(userId: string, cartId: string) {
  // Schedule 3 emails
  await emailScheduler.schedule({
    to: userId,
    template: 'cart_reminder_1h',
    sendAt: addMinutes(new Date(), 60),
    condition: () => !isCheckoutCompleted(cartId),
  });

  await emailScheduler.schedule({
    to: userId,
    template: 'cart_reminder_24h_discount',
    sendAt: addHours(new Date(), 24),
    condition: () => !isCheckoutCompleted(cartId),
  });

  await emailScheduler.schedule({
    to: userId,
    template: 'cart_reminder_3d_lastchance',
    sendAt: addDays(new Date(), 3),
    condition: () => !isCheckoutCompleted(cartId),
  });
}
What should the email include?
- Cart contents with images (so users remember what they picked)
- A direct checkout link (one-click return)
- A discount code (only in the 2nd and 3rd emails)
- Trust signals (returns policy, customer support)
- An unsubscribe link (mandatory)
Choosing an ESP
- Klaviyo — e-commerce-specific, pricier
- Mailchimp — general-purpose, moderate CR tooling
- Brevo (formerly SendinBlue) — European, GDPR-friendly
- Resend + Postgres — custom, developer-focused, cost-effective
9. Product page social proof
An "Others bought this" section combined with recent-purchase notifications lifts conversion by 5-15%.
<div className="rounded-lg bg-bg-surface p-4">
  <p className="text-sm">
    <strong>72-en</strong> vásárolták az elmúlt 7 napban
  </p>
</div>
Recent purchase notification
// Toast: "István, Budapest, bought this 5 minutes ago"
function RecentPurchaseNotification({ data }) {
  return (
    <div className="fixed bottom-4 left-4 z-50 rounded-lg bg-white p-3 shadow-lg
                    border max-w-xs animate-slide-in">
      <p className="text-xs">
        <strong>{data.firstName}</strong> ({data.city})
      </p>
      <p className="text-sm">{data.timeAgo}-kor vásárolta</p>
    </div>
  );
}
Source the data honestly: if 72 people really bought it, show that. If it's 3, don't lie.
Reviews — non-negotiable
| Reviews count |
Average CR uplift |
| 0 reviews |
0% (baseline) |
| 1-5 reviews |
+8% |
| 6-20 reviews |
+15% |
| 20+ reviews |
+22% |
Collect reviews through a post-purchase email flow. "Leave a review and get a 5% coupon for your next purchase" — 30-40% response rate.
10. A/B testing infrastructure
Every technique above is testable. Without A/B testing, impact is just a hypothesis.
PostHog feature flag setup
import { posthog } from 'posthog-js';

// Initialize (with consent)
posthog.init('phc_xxx', {
  api_host: 'https://eu.posthog.com',  // EU-region
  capture_pageview: false,  // GDPR-friendly default
});

// In component
function ProductPage({ product }) {
  const showStickyBar = posthog.getFeatureFlag('sticky-cart-bar') === 'variant_a';
  const showScarcity = posthog.getFeatureFlag('scarcity-message');

  return (
    <>
      {/* ... */}
      {showStickyBar && <StickyCartBar product={product} />}
      {showScarcity && stock <= 5 && <ScarcityBadge stock={stock} />}
    </>
  );
}
A/B testing rules
- A minimum of 1,000 conversions per variant for statistical significance
- A 2-3 week run time (to cover weekly cycles)
- A maximum of 2 variants at a time (more variants split the sample size too thin)
- One hypothesis per test — don't combine multiple features
Sample size calculator
Baseline CR:      2.0%
Detectable lift:  10% (relative)
Statistical power: 80%
Significance:     95%

→ Sample size: ~10,000 visitors per variant
→ At 1,000 visitors/day: a 10-day test
Evan's A/B Calculator is ideal for quick estimates.
Bonus: 5 more technical tricks
11. Image zoom + 360° view
For higher-value products, image zoom plus a 360° view adds +5-10% CR. Users get to "hold" the product virtually.
12. Live chat (chatbot or human)
A "questions?" button can add +3-7% to CR. Live chat during business hours (9am-5pm), an AI chatbot 24/7.
13. Free shipping threshold
A "You're X HUF away from free shipping" message in the cart. +12-18% lift in average order value.
14. Wishlist / Save for later
"Save for later" separates "interested" intent from "ready to buy" intent. The wishlist also doubles as a newsletter-targeting segment.
15. Hungarian payment methods
- SimplePay (OTP) — mainstream in the Hungarian market
- Barion — a Hungarian fintech alternative
- PayPal — international, B2B segment
- Apple Pay / Google Pay — a boost for mobile conversion
- Cash on delivery — still 15-20% of the Hungarian B2C market
The lack of Hungarian payment options often costs 30-40% CR in the Hungarian market.
Measurement and iteration
A project-level optimisation sprint (4-6 weeks) typically delivers a 30-60% relative CR increase over baseline.
Measurement framework
| Week |
Activity |
| 1 |
Audit (Lighthouse, Hotjar, analytics review) |
| 2 |
Prioritisation — top 5 issues with impact estimates |
| 3 |
Implement 1-2 quick wins |
| 4 |
A/B test launches, monitoring |
| 5 |
Results review, iteration |
| 6 |
Production rollout, follow-up audit |
Official docs and further reading
Related articles from us: Next.js 16 production-ready checklist — performance fundamentals. Headless CMS in Hungary — choosing a content stack. Mobile app GDPR compliance — analytics and consent management.
Closing thoughts
Webshop conversion rate never comes down to a single trick. The cumulative effect of the 10 techniques above is substantial. A project-level optimisation sprint (4-6 weeks) typically delivers a 30-60% relative CR increase over baseline.
Measurement is the key. Without A/B testing infrastructure, changes remain just hypotheses. PostHog or GrowthBook can be integrated free of charge and up and running within 1-2 weeks.
If you're planning a webshop development or optimisation project, let's talk it through in a discovery call to find where the biggest wins are. A 1-2 week audit (300,000-600,000 HUF) often pays for itself 5-10x within the first 3 months once the quick wins are implemented.